
Explore technical guides, BMS engineering best practices, and industry news from APEX Mobile Power experts.
Battery systems are becoming more demanding, connected, and difficult to evaluate across borders. The International Energy Agency’s Global EV Outlook 2024 reported more than 14 million electric car sales in 2023, representing about 18% of global new-car sales. Its Batteries and Secure Energy Transitions report also estimated that electric-vehicle battery demand reached roughly 750 GWh in 2023. These figures show why buyers need more than cell capacity and a low quotation.
A Smart Battery Management System can monitor voltage, temperature, current, state of charge, and state of health. It can also support balancing, fault alerts, remote diagnostics, and safer charging decisions. In practical sourcing work, small details matter. A sensor placed near a hot module may reveal thermal stress earlier than a dashboard warning. A weak communication protocol can create delays during warranty investigations. The system must fit the battery, charger, vehicle, software, and service network.
No checklist is perfect. Data is not always clean. Global buyers should verify test conditions, firmware controls, cybersecurity practices, replacement procedures, and applicable certifications before comparing suppliers. Reports from the IEA provide strong market context, but they cannot replace independent validation. This guide presents seven practical tips for evaluating a Smart Battery Management System with clearer technical questions and more realistic risk controls. Some recommendations may seem obvious. They are often missed. A reliable decision combines documented performance, supplier experience, transparent limitations, and evidence from real operating environments.
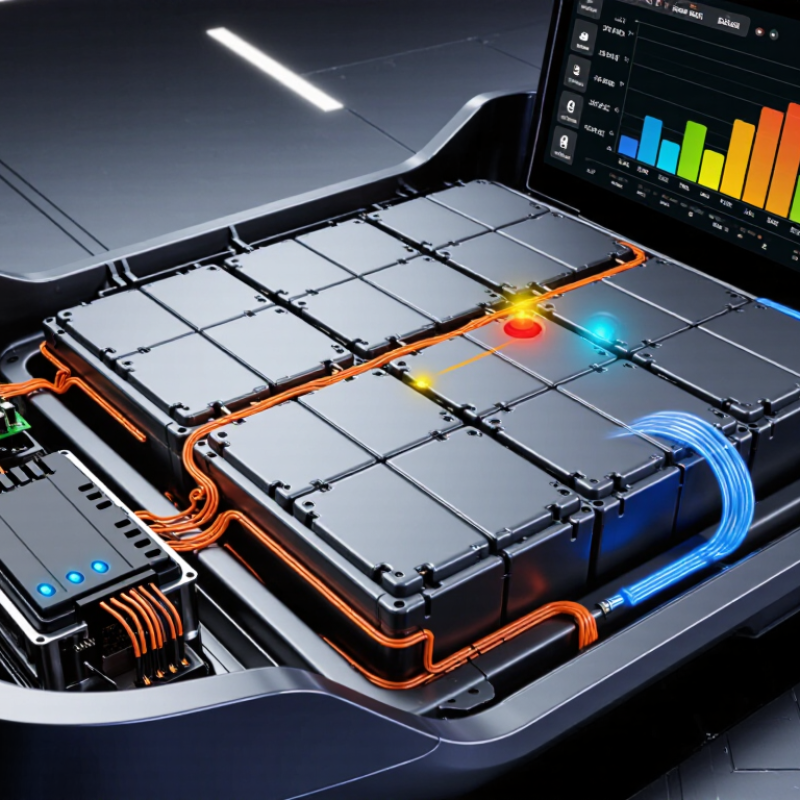
A reliable battery management system starts with the cell chemistry, not the circuit board. Most standard lithium-ion cells are rated at 3.6–3.7 V nominal. This figure describes average operating voltage, not the charging limit. A typical cell may reach 4.2 V when fully charged, but the exact value depends on its chemistry and manufacturer specifications.
Define the pack target before selecting a BMS. Four cells in series create a pack near 14.4–14.8 V nominal. Capacity increases through parallel connections, while series connections increase voltage. I have seen buyers confuse these two functions, creating unsuitable protection settings. Confirm the required voltage, capacity, peak current, operating temperature, and expected cycle life with real load data. Guessing from motor labels is risky.
Tip: Match every BMS voltage threshold to the approved cell datasheet. Check overcharge, over-discharge, short-circuit, temperature, and balancing functions. Passive balancing may be adequate for small packs, but high-capacity designs can need closer monitoring. Request cell traceability, production test records, and safety reports from the supplier. Standards and shipping requirements vary by market, so verify current documentation before purchase. Small details matter. Also, do not assume every 3.7 V cell behaves identically; aging, temperature, and storage history can shift performance. A controlled prototype test may reveal weaknesses that specifications miss.
| Cell Chemistry | Typical Nominal Voltage | Typical Full-Charge Voltage | Typical BMS Over-Discharge Cutoff | Recommended Pack-Series Target | Typical Characteristics | BMS Design Consideration |
|---|---|---|---|---|---|---|
| Nickel Manganese Cobalt Oxide (NMC) | 3.6–3.7 V | 4.20 V | Approximately 2.5–3.0 V | 10S: 36–37 V nominal 13S: 46.8–48.1 V nominal |
Balanced energy density, power capability, and cycle life; widely used in mobility and portable energy systems. | Set over-voltage, under-voltage, temperature, current, and balancing limits for the exact NMC cell model. |
| Nickel Cobalt Aluminum Oxide (NCA) | Approximately 3.6 V | 4.20 V | Approximately 2.5–3.0 V | 10S: Approximately 36 V nominal 13S: Approximately 46.8 V nominal |
High energy density and good power performance when operated within strict thermal and charging limits. | Use accurate temperature sensing and conservative charge-current limits; avoid assuming NMC and NCA limits are interchangeable. |
| Lithium Cobalt Oxide (LCO) | Approximately 3.6 V | 4.20 V | Approximately 2.75–3.0 V | 10S: Approximately 36 V nominal 13S: Approximately 46.8 V nominal |
High energy density but generally lower thermal stability and cycle life than many newer lithium-ion chemistries. | Prioritize thermal protection, accurate voltage measurement, and strict avoidance of overcharge. |
| Lithium Iron Phosphate (LFP) | 3.2–3.3 V | 3.65 V | Approximately 2.5–2.8 V | 12S: 38.4–39.6 V nominal 16S: 51.2–52.8 V nominal |
Long cycle life, strong thermal stability, and lower energy density than NMC, NCA, or LCO. | Do not use a 4.20 V-per-cell charger or BMS profile; LFP requires its own voltage thresholds and state-of-charge model. |
| Lithium Titanate (LTO) | 2.3–2.4 V | Approximately 2.7–2.85 V | Approximately 1.5–1.8 V | 15S: Approximately 35–36 V nominal 20S: Approximately 46–48 V nominal |
Very high cycle life and excellent low-temperature and high-power performance, but lower energy density and higher cost. | Use an LTO-specific charger and BMS configuration; series count cannot be selected using 3.6–3.7 V-cell assumptions. |
| 3.6–3.7 V Li-Ion Pack Example | 3.6–3.7 V per cell | 4.20 V per cell | Cell limit × series count | 10S: 36–37 V nominal; 42.0 V full 13S: 46.8–48.1 V nominal; 54.6 V full |
Suitable as a planning reference for conventional 4.20 V-per-cell Li-ion chemistries such as many NMC, NCA, and LCO cells. | Specify series count, parallel count, charge voltage, discharge cutoff, continuous current, peak current, balancing method, and temperature limits together. |
SOC estimates remaining charge. SOH reflects aging and usable capacity. Specify both accuracy ranges before purchase. Otherwise, comparisons become vague and risky.
Combine coulomb counting with voltage readings. Current tracking follows energy entering and leaving the battery. Voltage provides a correction point. Chemistry still matters.
Define current, voltage, and temperature sampling rates. Request accuracy data across low, medium, and high loads. Include temperature, charging rate, and battery age. Slow sampling can miss rapid current changes.
Compare the displayed SOC with a calibrated energy meter. Record readings after charging, resting, and several discharge cycles. Rest periods help. Not perfectly, though. Different cell chemistries may produce misleading voltage corrections.
Use capacity tests, internal resistance trends, or both. Do not rely on one sudden reading. Record results across repeated cycles. Aging rarely behaves neatly.
Use layered protection for voltage, current, temperature, and abnormal conditions. Add cell-level sensing, contactor control, thermal alerts, and a defined shutdown strategy. Keep event logs traceable. Small details matter.
Ask how the system responds to sensor drift, welded contactors, and cooling failure. Verify the answers with fault-injection tests and independent reviews. Controlled software changes are essential. Normal operation is not enough.
Request transport-test records covering altitude, temperature cycling, vibration, shock, short circuits, overcharge, and forced discharge. Match documents with the shipped model, serial numbers, enclosure, and production revision. Check the carton, terminals, labels, and packaging. Paperwork can look complete. Records should travel with the shipment.
For global buyers, selecting a Smart Battery Management System begins with clearly defining the battery cell chemistry and pack targets. For common lithium-ion designs, 3.6–3.7 V nominal cells provide a useful reference, but the complete pack specification should also address capacity, voltage range, operating temperature, and intended application. Accurate state-of-charge and state-of-health monitoring is equally important. Combining coulomb counting with voltage-based data can improve measurement reliability, especially when supported by suitable sampling rates, calibration, and diagnostic functions.
Safety and long-term performance should be verified through multiple protection layers, including overcharge, over-discharge, overcurrent, short-circuit, and temperature controls aligned with relevant IEC 62619 and ISO 26262 principles. Buyers should also confirm thermal behavior and shipping readiness under UN 38.3 test conditions. Finally, supplier comparisons should rely on documented cycle-life results measured to 80% SOH, together with traceability records for cells, production batches, firmware, and quality inspections. These checks help reduce technical risk and support consistent, maintainable battery deployments.



.png)